Energy
US solar energy capacity up 418% in four years
Solar energy capacity in the US has increased by 418% in the last four years alone, newly released data has revealed.
Figures from the US Energy Information Administration (EIA) show that in 2010, America’s total solar capacity was just 2,326 megawatts. As of February this year, however, capacity had increased to 12,057MW.
Although solar still makes up a small share of America’s energy capacity – at around 1.1% – the EIA expects the industry’s rise to continue, going from a “relatively small contributor” to “one of comparative significance”.
The figures show that this growth has been driven partly by residential and commercial rooftop photovoltaic (PV) installations that are net-metered.
Net-metered solar systems allow customers generating their own electricity to feed surplus power back into the grid in exchange for credit. The EIA say that installations of this type in the US have increased at an annual rate of about 1,100 MW since 2010.
They are also spread out unevenly. Perhaps unsurprisingly, sunny California currently has the largest net-metered solar capacity with 38% of the nation’s total – though the EIA stress that incentivising state policies are just as important as accommodating weather.
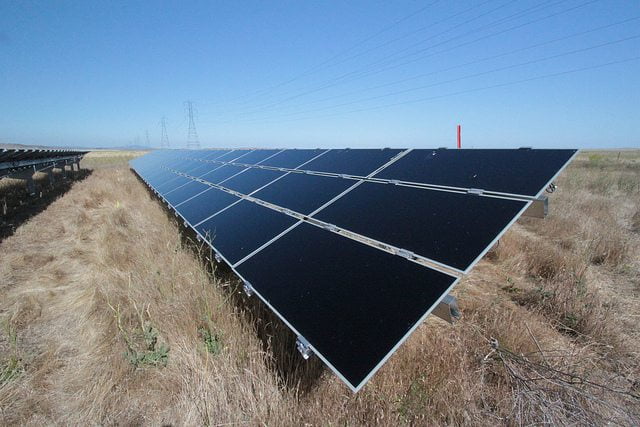
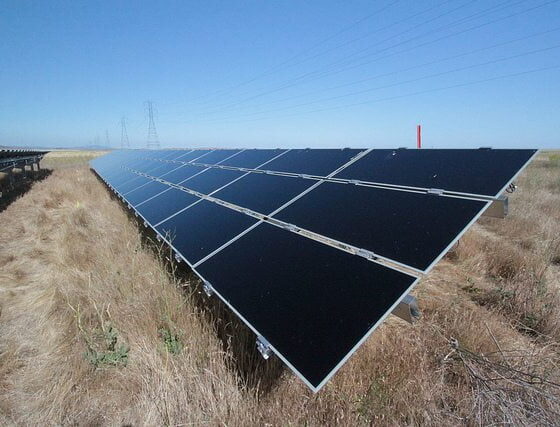
Meanwhile, larger utility-scale PV applications, defined as installations of 1MW or more, have also become a more common sight across America and now provide 5,564 MW of capacity, meaning they have overtaken net-metered systems.
California also has a considerable 49% of installed utility-scale PV capacity, followed by Arizona with 17% and North Carolina with 6%.
Glenn McGrath, the author of the EIA report, adds that this encouraging trend has the potential to revolutionise America’s energy mix.
“[Solar is] displacing everything,” he said.
“Renewables – once you get them on the system, they’re always the first to be dispatched. Because they’re dispatched first, they’re displacing everything – coal, gas, nuclear – depending on where you are in the country.”
Figures released last week by the US Environmental Protection Agency showed that over the course of 2012, the USA’s total greenhouse gas emissions fell by 3.4%.
This cut equals a reduction of almost 10% from 2005 levels – the benchmark by which the US government measures its emission reductions. The government’s 2020 target demands a reduction of 17% from that baseline.
However, experts have suggested that these reductions were made primarily due to the increased use of shale gas, rather than renewables.
The gas, while still a fossil fuel, is less polluting and America’s fracking boom has reduced dependency on more carbon intensive coal.
The most recent report from the Intergovernmental Panel on Climate Change (IPCC) – a comprehensive study on how global warming can be mitigated – does concede that shale gas could play a role in decarbonisation, but only as a short-term option.
Instead, the IPCC say that a trillion-dollar shift in investment towards renewable energy is urgently needed.
Photo: Russ Ferriday via flickr
Further reading:
US carbon emissions fall 3.4% in 2012
Seven countries responsible for two-thirds of climate change, research shows
Obama sends strong climate change message to global counterparts in speech
Protesters rally in Washington to urge US climate action
US energy-related carbon emissions at lowest point since 1994

