Economy
How wide is the wealth gap?
The Global Wealth Report 2013 from Credit Suisse revealed that wealth had hit an all-time high of $241 trillion by the middle of 2013, despite challenging conditions. However, the report suggests that the wealth gap is continuing to increase at an accelerated pace.
Global wealth increased by 4.9% in between mid-2012 and mid-2013, and has jumped by 68% in the last decade. Whilst some wealth inequality is expected, the extent and breadth of the gap is often underestimated in the public’s perception.
Is Britain as fair as it seems?
According to The Global Wealth Report, the wealth distribution in the UK is very typical for a developed country. Slightly more than half of the population has wealth exceeding $100,000 and there are 1.5 million millionaires in the country, although average wealth per adult still remains well below the level achieved pre-financial crisis.
According to the below video from Inequality Briefing, though, this wealth is unfairly distributed.
The richest 20% in the UK have 60% of the wealth, 100 times more than those in the bottom 20% have. Inequality is even more evident when the top 1% is examined. This section of society has as much wealth as 60% of the population combined.
Inequality Breifing says that this gap is a result of more than 30 years of inequality.
The actual wealth distribution is in contrast to how the UK public thinks wealth should be distributed. A poll found that the public felt the top 20% should have 25% of the wealth, whilst the bottom 20% should have around 15%.
The public is also aware this isn’t the case and understand that wealth is distributed unequally but not to what extent. When the public was asked how they thought the wealth was distributed they believed the richest fifth hold 40% of the wealth, whilst the poorest have 9%.
How does the UK compare to the US?
Another video, this time by a filmmaker called Politizane, shows that the gap between the perception and reality of the wealth distribution in the US is broadly similar to that of the UK.
Compared to the rest of the world, the US has a high proportion of population with wealth above $100,000, and this percentage becomes more disproportionate at higher wealth levels. The USA has by far the greatest number of members of the top 1% wealth group globally, and accounts for 42% of the world’s millionaires.
In a survey, the US public felt that wealth should be more equitably distributed than what they thought in was. However, the reality shows that the bottom 40% have barley any of the wealth, whilst the top 1% has more of the country’s wealth than nine out of 10 of those questioned felt the top 20% should have.
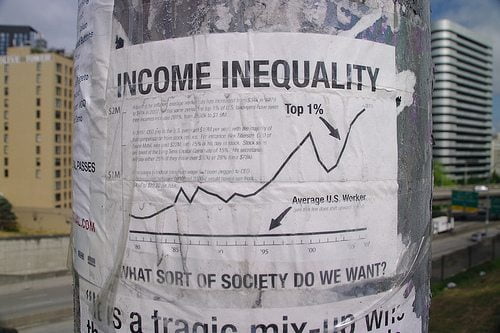
The actual wealth distribution shows that the richest 1% actually holds 40% of all the nations wealth. In stark contrast, the bottom 80% holds just 7%, highlighting the vast wealth inequality in the US.
The situation in the country has been worsening. In 2012 the top 1% took home 24% of the country’s incomes, this compares to the 9% they took in 1976.
How does this compare to global wealth distribution?
Globally the wealth gap is larger. A third video, by The Rules, visualises the information in the Credit Suisse report, showing that the richest 20% holds 94% of the world’s wealth, while the top 2% have more wealth than the rest of the world combined.
The vast gap between the haves and the have nots is demonstrated by the fact that the 300 richest people have the same wealth as the poorest three billion.
The wealth gap can also be identified geographically, with the gap widening between the richer countries, which includes North America, Western Europe and Australia, and poorer countries.
The gap has rapidly been expanding. Two hundred years ago, rich countries were only three times richer when compared to countries with lower wealth. By the 1960s, this ratio had risen to 36 times, and today it is at around 80 times wealthier.
The video argues that whilst rich countries try to compensate for this by giving around $130 billion in aid each year, other factors mean poorer countries are continuing to lose out. These include large corporations taking around $900 billion out of poor countries through a form of tax avoidance each year, debt service on previous loans and unfair trade rules.
These things mean that more than $2 trillion flows from some of the poorest countries in the world to the richest, resulting in the financial aid ultimately having very little or no impact.
Global wealth is projected to rise by over 40% in the next five years, reaching $334 trillion in 2018. Whilst this increase is expected to be driven by the middle class and emerging markets it is likely that much of this wealth will be in the pockets of the already rich.
Wealth mobility tends to be low in regions that have an unequal distribution of wealth. According to the Credit Suisse report, China has the highest mobility, followed by India. North America has the lowest mobility, with Europe only slightly better.
From a global perspective, wealth mobility is similar to that seen in North America and Europe. This suggests that as we progress, it is becoming increasingly difficult for people to move up in terms of wealth and for society to close the gap.
Further reading:
Global wealth at ‘all-time high’ of $241tn, but inequality still rife
We can no longer sit comfortably with the myths behind poverty
‘We need to tackle the root causes of inequality and poverty’
Mobilising money to close the equality gap
Sustainable development must include tackling inequality, says UN


Eco-Friendly Kitchen Deep Cleaning Tips for a Healthier Home

Ananeva’s Research Shows Arctic Ships Don’t Need Icebreakers

Repairing, Replacing, or Upgrading Windows for Sustainability

Are 4-in-1 Taps Worthwhile for Eco-Friendly Homes?

Pedestrian and Bicycle Accidents in Chicago’s Crowded Urban Areas

Neel Somani Discusses the Energy Market Design and How Pricing Actually Works

Eco-Friendly Landscaping: How Homeowners go Green Outdoors

Do You Need Solar Panels for Whole Home Battery Backup?

Collisions Involving Sudden Door Openings from Parallel-Parked Cars

Eco-Friendly Workplaces and Storm Attendance Challenges

 Energy11 months ago
Why Ireland Should Invest More in Solar Energy
- Environment12 months ago
Cool Your Home Naturally: Green Alternatives to Cranking the AC
- Environment9 months ago
Small Choices, Big Impact: Cutting Your Daily Carbon Footprint
- Features10 months ago
Breathing Easy: How Pool Chemicals Affect Lung Health And Safety