Features
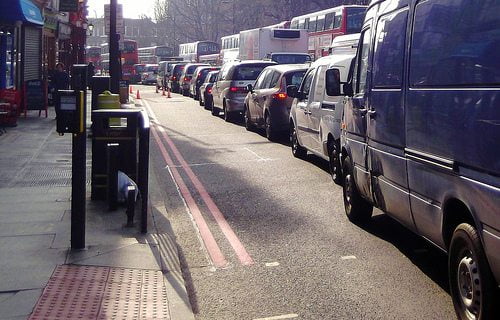
Interactive map: where are London’s most polluted streets?
It was announced in June that the air in London was among some of the dirtiest in Europe, according to the Environment Agency.
Jenny Jones, London assembly member for the Green party, has created an interactive map that shows the pollution levels throughout the capital, in an effort to force transparency upon the mayor’s office.
Jones, who was a Green member for Southwark council from 2006 to 2010, says the map shows just how dirty the air in the ‘big smoke’ is.
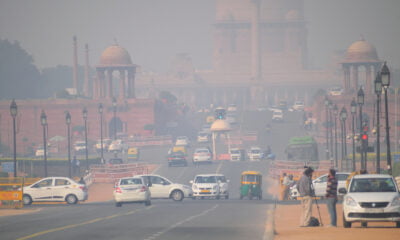
She said, “The government and the mayor have tried to play this problem down, but the impacts on human health can be severe.
“The mayor could and should be doing so much more to tackle this problem but under his watch London failed to meet EU air quality standards in 2011 and is set to continue breaching legal limits until 2025.”
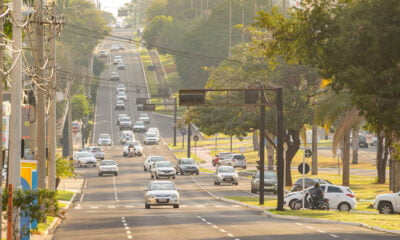
She added that the way to tackle these issues is to introduce policies which will support a cleaner lifestyle for Londoners.
“The two key steps the mayor needs to take to make this happen are to lower fares and to create a safe space for people to cycle”, she said.
She also commented on how electric vehicles would have a positive impact by reducing carbon emissions. The EV industry is predicted to grow by more than 200%, to a value of £2.8 billion by 2020.
See the interactive map below.
Map key
The amount of pollution is…
High
Low
London boundary
Congestion charge zone
See more here.
Published by Jenny Jones, Green Party Member of the London Assembly.
Further reading:
East London has four of five most polluted streets in the capital
Government admits to breaching legal air quality limits


Half of UK offices send furniture to landfill. Why is nobody talking about it?

Why Starting a Green Business as an LLC Makes Sense

Eco-Friendly Kitchen Deep Cleaning Tips for a Healthier Home

Ananeva’s Research Shows Arctic Ships Don’t Need Icebreakers

Repairing, Replacing, or Upgrading Windows for Sustainability

Are 4-in-1 Taps Worthwhile for Eco-Friendly Homes?

Pedestrian and Bicycle Accidents in Chicago’s Crowded Urban Areas

Neel Somani Discusses the Energy Market Design and How Pricing Actually Works

Eco-Friendly Landscaping: How Homeowners go Green Outdoors