
News
Local elections: pollution and waste infographic analysis
Tomorrow, just under half of the UK’s local councils will be holding elections. If you’re stuck for which party to vote for, Blue & Green Tomorrow is on hand to give you some eleventh hour statistics that might sway your opinion.
As Blue & Green Tomorrow founder and publisher Simon Leadbetter often declares: “The problem is pollution and waste”.
Underlying many of the debates around the environment is the often overlooked fact that these two issues form the basis of almost every single challenge we face as a planet.
And it has been proven that tackling this deadly duo of problems head on makes a whole lot of difference, which is why in this timely piece focusing on the UK local elections, we’re examining just how green each of the 405 constituencies are.
Local councils have the potential influence how much pollution comes from their area, and how much waste is produced or recycled, so these are the two aspects that we’ll be looking at in detail.
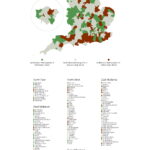
But before we do that, we’ve done an infographic to show the political control of each constituency. Please note, though, that not all have elections tomorrow. The ones that do are marked with a black ballot box at the bottom of the image.
In terms of the environmental stances of each of the three main political parties – Conservatives, Labour and Liberal Democrats – the BBC’s policy guide from the General Election in 2010 is a good place to start.
With regards to pollution, the Conservatives’ objective was an 80% reduction in greenhouse gas emissions by 2050. Labour mirrored this target, but added a 34% reduction aim by 2020. The Lib Dems meanwhile, were the most ambitious of the three, with a 40% goal by 2020 and a 100% by 2050.
And if you really want to take a strong stance, there’s always the Green Party option…
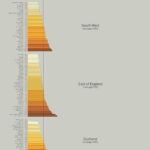
Looking more locally, we’ve analysed the latest emissions data and produced an infographic to show the best and worst emitters, per capita, in the UK.
If it’s a bit too difficult locating your area, the list underneath the map shows the emissions per capita of all the constituencies, as well as a comparison against the regional average.
Still undecided as to which party you’ll vote for? Luckily, we’ve got one more piece of analysis to help you make that choice.
It concerns waste, and the amount that is recycled by each constituency in a year, though this time only in England.
This area in particular is something that local authorities have direct control over, so it’s arguably a better snippet of information ahead of a local election.
The top two maps show the authorities that recycled the most waste in 2011, as well as the ones that improved the most between 2010 and 2011. The larger map underneath, meanwhile, highlights whether each place was marked as green in one, two or none of the above maps.
If your area is one of the ones marked as brown, perhaps it’s time for a change of political control?
Regardless of how (and if) you vote tomorrow, B> believes that pollution and waste figures should be incorporated in some way into your decision, as they’re such important economic, environmental and social issues.
On a national basis, the Coalition Government has, from our perspective, significantly underwhelmed with regards to its green agenda. It was installed under the guise of the “greenest government ever”— something which it is still struggling to prove two years in.
But did the Labour Government before that fare any better with environmental issues? That’s quite possibly another infographic…
What is certain is that individuals, as well as local authorities, can make a massive difference to the UK’s pollution and waste numbers—continuing to read Blue & Green Tomorrow and keeping abreast of the issues will help.
Continue to use the “reduce, reuse, recycle” mantra. And then there’s always 100% renewable energy to consider—visit Good Energy to find out more.
Finally, our Guide to Sustainable Investment lays out the reasons for more seriously considering what your money is supporting. In everything that we do, we must balance the needs of the planet, its people and prosperity.
Happy voting!
Further reading:


