Features
Local and regional carbon emissions: responses
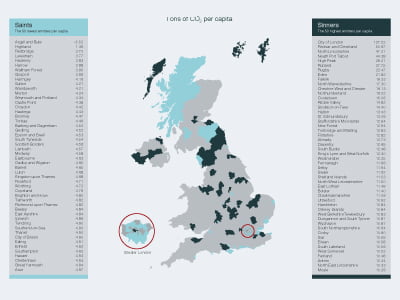
Using Department for Energy and Climate Change (DECC) figures, Blue & Green Tomorrow created a new infographic to show how much carbon dioxide is emitted by each UK local authority. We caught up with some of the saints and sinners about their performances.
Saint: Argyll and Bute (-5.52 tonnes of CO2 per capita)
The figures are a reflection of the size of our area, small and dispersed population, low number of vehicles and lack of significant heavy industries. However we are doing many positive things at Argyll and Bute Council to secure and further build on these positive figures.
One of these is a recent investment in four hybrid vehicles, three 17 seater minibuses and a transit van. These are replacing older diesel vehicles and were bought as part of the effort to tackle climate change. This is an important first step in reducing transport emissions and it is predicted that fuel savings and carbon release will be reduced by between 15-25%.
Also, since 2009, Argyll and Bute and partners have developed an Economic Development Action Plan 2010-2013, a Renewable Energy Action Plan 2011 and a Woodland and Forestry Strategy 2011.
Sinner: Redcar and Cleveland (50.67 tonnes of CO2 per capita)
We have one of the highest total CO2 emissions by local authority area in the UK but as a direct result of the level of industrial and commercial activity in the borough, which we do not directly control.
However, our emissions reductions are amongst the highest in the UK both in terms of total tonnages and per capita reductions, which has been influenced by a combination of the activity of the private sector, national economic instability, but also the Council prioritising carbon reduction and investing heavily in mitigation measures such as renewable energy programmes.
Therefore in our view, it would misleading to attribute the term ‘sinner’ to any local authority in the upper quartile of total CO2 emissions where they are dominated by industrial and commercial activity, but the focus should be on their direction of travel in terms of emissions reductions and the measures they are employing to ensure that the reductions are sustainable.
Saint: Highland (1.39 tonnes of CO2 per capita)
This data, showing emissions removals, is more reflective of our large geography and rural nature and land use such as forestry and peat flows than of local authority action, and it would be misleading to present the actions we are taking, if they are to be related to this dataset.
In the data set under the control of Local Authorities you will see that Highland has the 4th largest overall emissions of local authorities (in Scotland) and has the highest overall per capita emissions at 9.7 tonnes. Per capita emissions we have, however, reduced by 14% between 2005 and 2009, which, for Scotland is a faster than average reduction rate. Internally our organisation has reduced emissions by 6.3% since 2009.
The most comprehensive list of actions Highland Council has undertaken can be found on the SSN website where all local authority annual reports towards climate change are presented.
Sinner: City of London (127.52 tonnes of CO2 per capita)
When DECC released the Local Authority Emissions statistics in 2009 it came as a bit of a blow, as we pride ourselves on walking the talk!
When we unpicked the way in which the statistics had been compiled we found the reason for our poor showing was that the per-capita emissions quoted are based on our tiny residential population (8,000 at the time of the DECC survey) and take no account of the 333,000 people who commute into the City to work every day, in the 11,000 businesses based here. The financial services sector [is a] surprisingly high consumer of electricity (the most carbon intensive form of energy) due to their data servers and air conditioning plant.
However, we are not complacent—on the heels of the DECC report, we commissioned our own carbon footprint analysis of the City in order to provide a firm foundation for our Climate Change Mitigation Strategy. This has set us goals which are in line with the Mayor of London’s targets for carbon reduction in London.
Regardless of the reasons for being the best or the worst local authorities on the carbon emissions list, the fact is, the UK desperately needs to curb its carbon emissions across all areas and sectors, if we’re going to tackle climate change successfully.
At a personal level, adopting renewable energy in your home (see Good Energy for information) or investing your money in companies that actively seeks solutions to climate change (fill in our online form to be put in touch with a specialist) are both options to make a real difference.
Further reading:


5 Eco-Friendly Home Improvements to Improve Mobility for Seniors

Why Ireland Should Invest More in Solar Energy

The True Cost Of Food Spoilage

What’s Filling Our Waste Streams? A Breakdown Of Packaging Waste

Buying Secondhand: How Used Construction Equipment Reduces Environmental Impact

Eco-Friendly Sustainable Supplements: Green Health Approach

The Hidden Environmental Costs of Bus Accidents in NYC

Finding the Best Eco-Friendly Crypto Listing Agencies

Do Eco-Friendly Homes Sell Faster or Just Look Better?

A Breath of Fresh Air: Your Guide to Eco-Friendly Roofs

Cool Your Home Naturally: Green Alternatives to Cranking the AC

Eco-Friendly Home Upgrades That Start With Sustainable Tiles
Do Eco-Friendly Homes Sell Faster or Just Look Better?
A Breath of Fresh Air: Your Guide to Eco-Friendly Roofs
Finding the Best Eco-Friendly Crypto Listing Agencies
Buying Secondhand: How Used Construction Equipment Reduces Environmental Impact
Eco-Friendly Sustainable Supplements: Green Health Approach
What’s Filling Our Waste Streams? A Breakdown Of Packaging Waste
The Hidden Environmental Costs of Bus Accidents in NYC